1. The Financial Times on smartphones and fertility
In "Why Birth Rates Are Falling Everywhere All at Once" (May 16, 2026), John Burn-Murdoch presents a graph that appears to show how eight countries' "smartphone take-off" year was followed by plunging total fertility rates. To replicate it below, we extracted the underlying data from the infographics from ft.com:
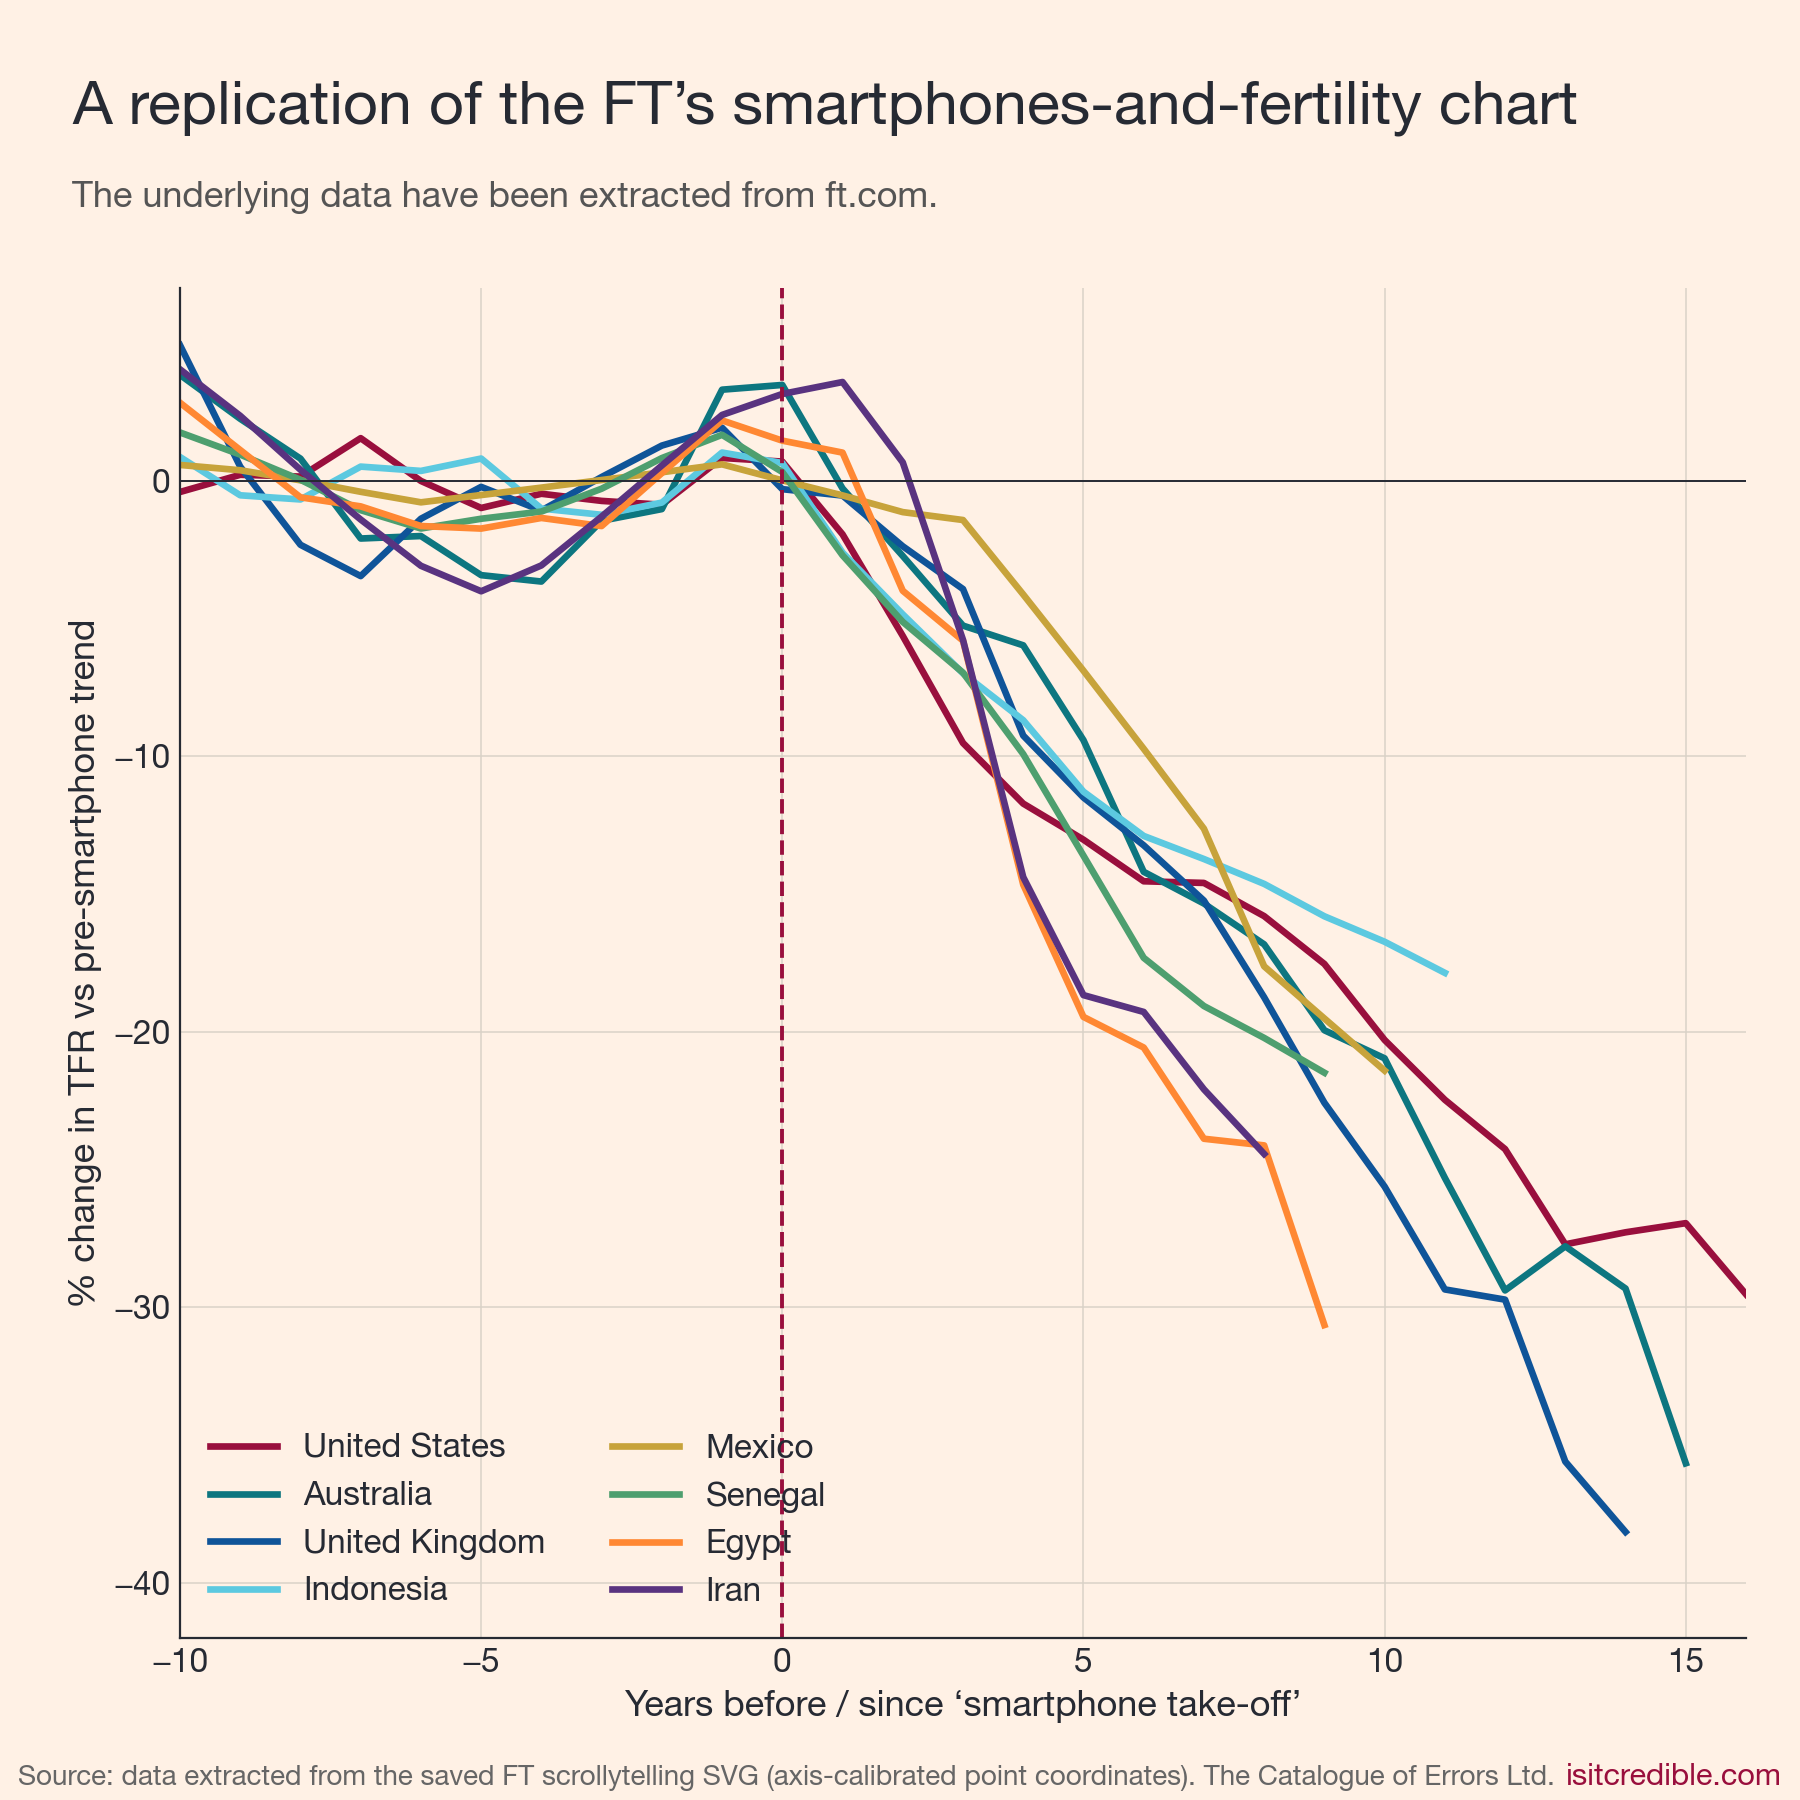
The first question we asked was how the FT determined the take-off years. The original graph's footnote states "Smartphone take-off based on surveys of smartphone adoption and Google searches for app stores," and cites, among other things, Google Trends and Pew Research Center, among other sources. So we checked.
We were not able to find anything to support the FT's choice.
When searching Google Trends for "App Store" and "Play Store" in the local languages, we found this:
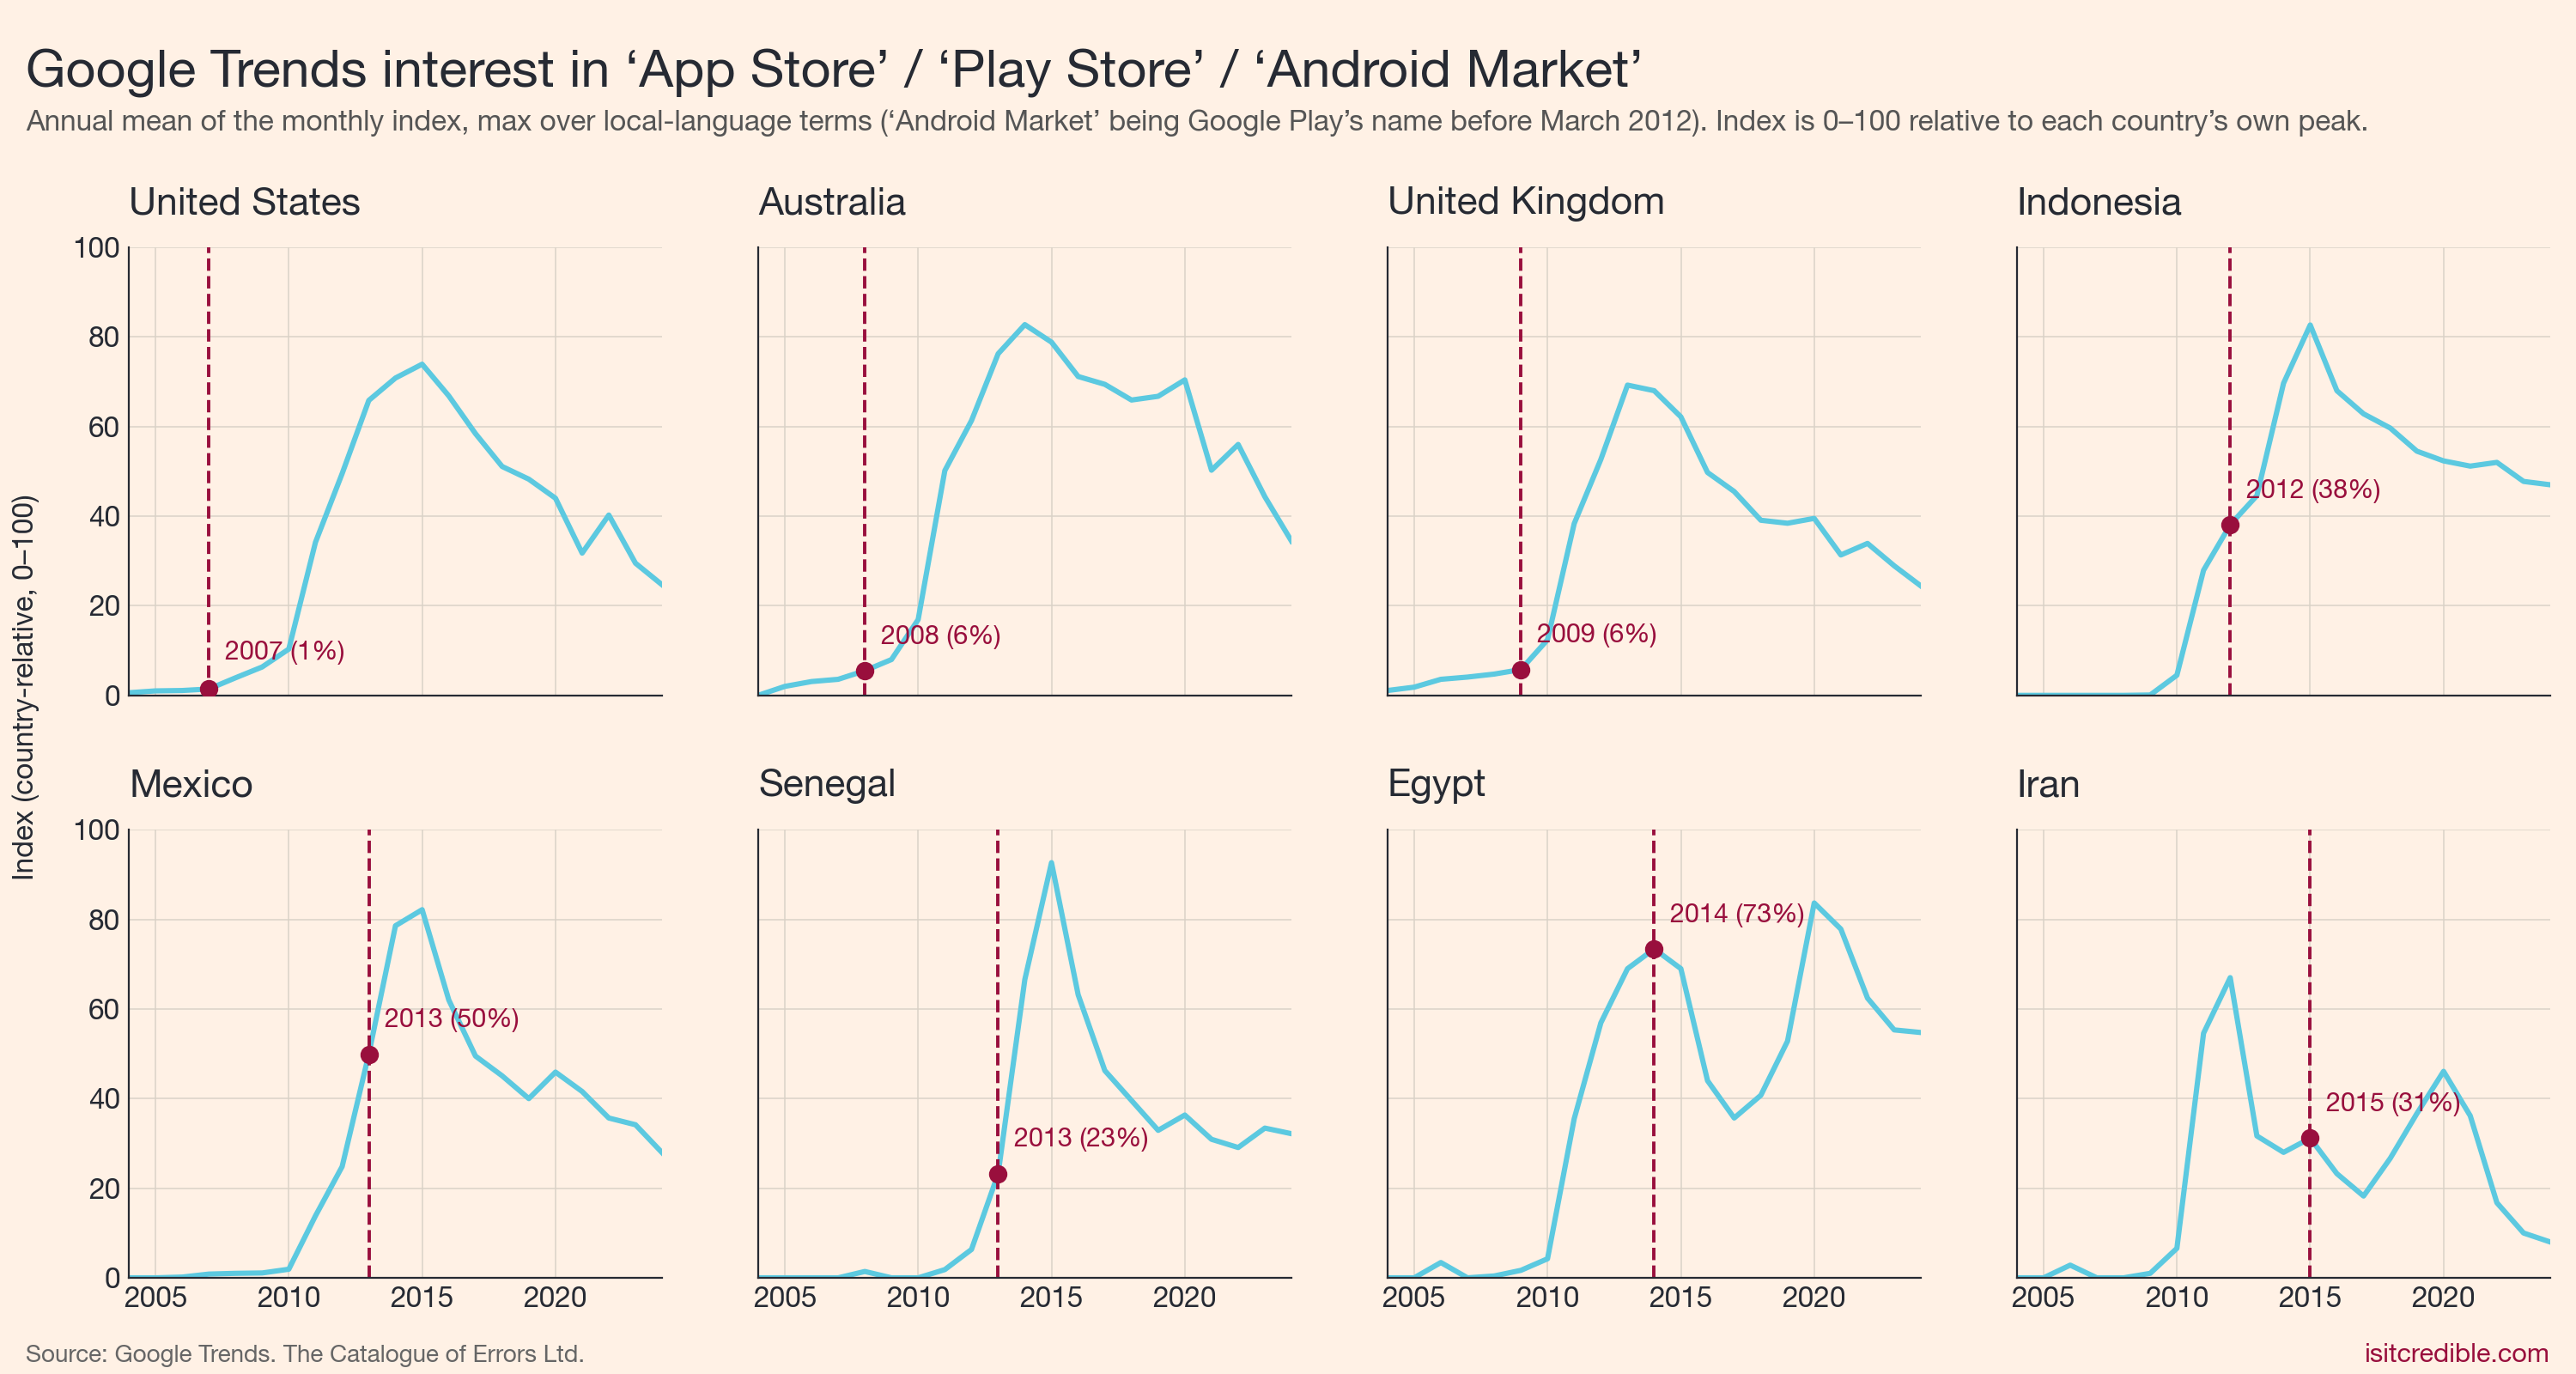
The FT appears to have chosen arbitrary years for each country, without any relationship to the actual Google Trends data they cite.
The Pew Research Center's data on smartphone adoption also fails to support their take-off years:
| Country | FT chart take-off year | Smartphone ownership in that year |
|---|---|---|
| United States | 2007 | ~0% (iPhone launched mid-2007; Pew's first US observation is 35% in 2011) |
| Australia | 2008 | <10% (ACMA/Deloitte's first observation is 65% in 2013; iPhone 3G launched mid-2008) |
| United Kingdom | 2009 | ~15% (Pew's first UK observation is 55% in 2013; back-extrapolation gives mid-teens for 2009) |
| Indonesia | 2012 | ~10% (Pew 2013: 14%; linear back-extrapolation gives ~10% for 2012) |
| Mexico | 2013 | 21% (Pew 2013 Global Attitudes round, direct observation) |
| Senegal | 2013 | ~14% (Pew 2014: 16% and Pew 2015: 19%; back-extrapolation gives ~14%) |
| Egypt | 2014 | ~22% (interpolation between Pew 2013: 17% and Pew 2015: 28%) |
| Iran | 2015 | ~36% (ISPA estimate; consistent with Pew 2014: 25% and Pew 2017: 58%) |
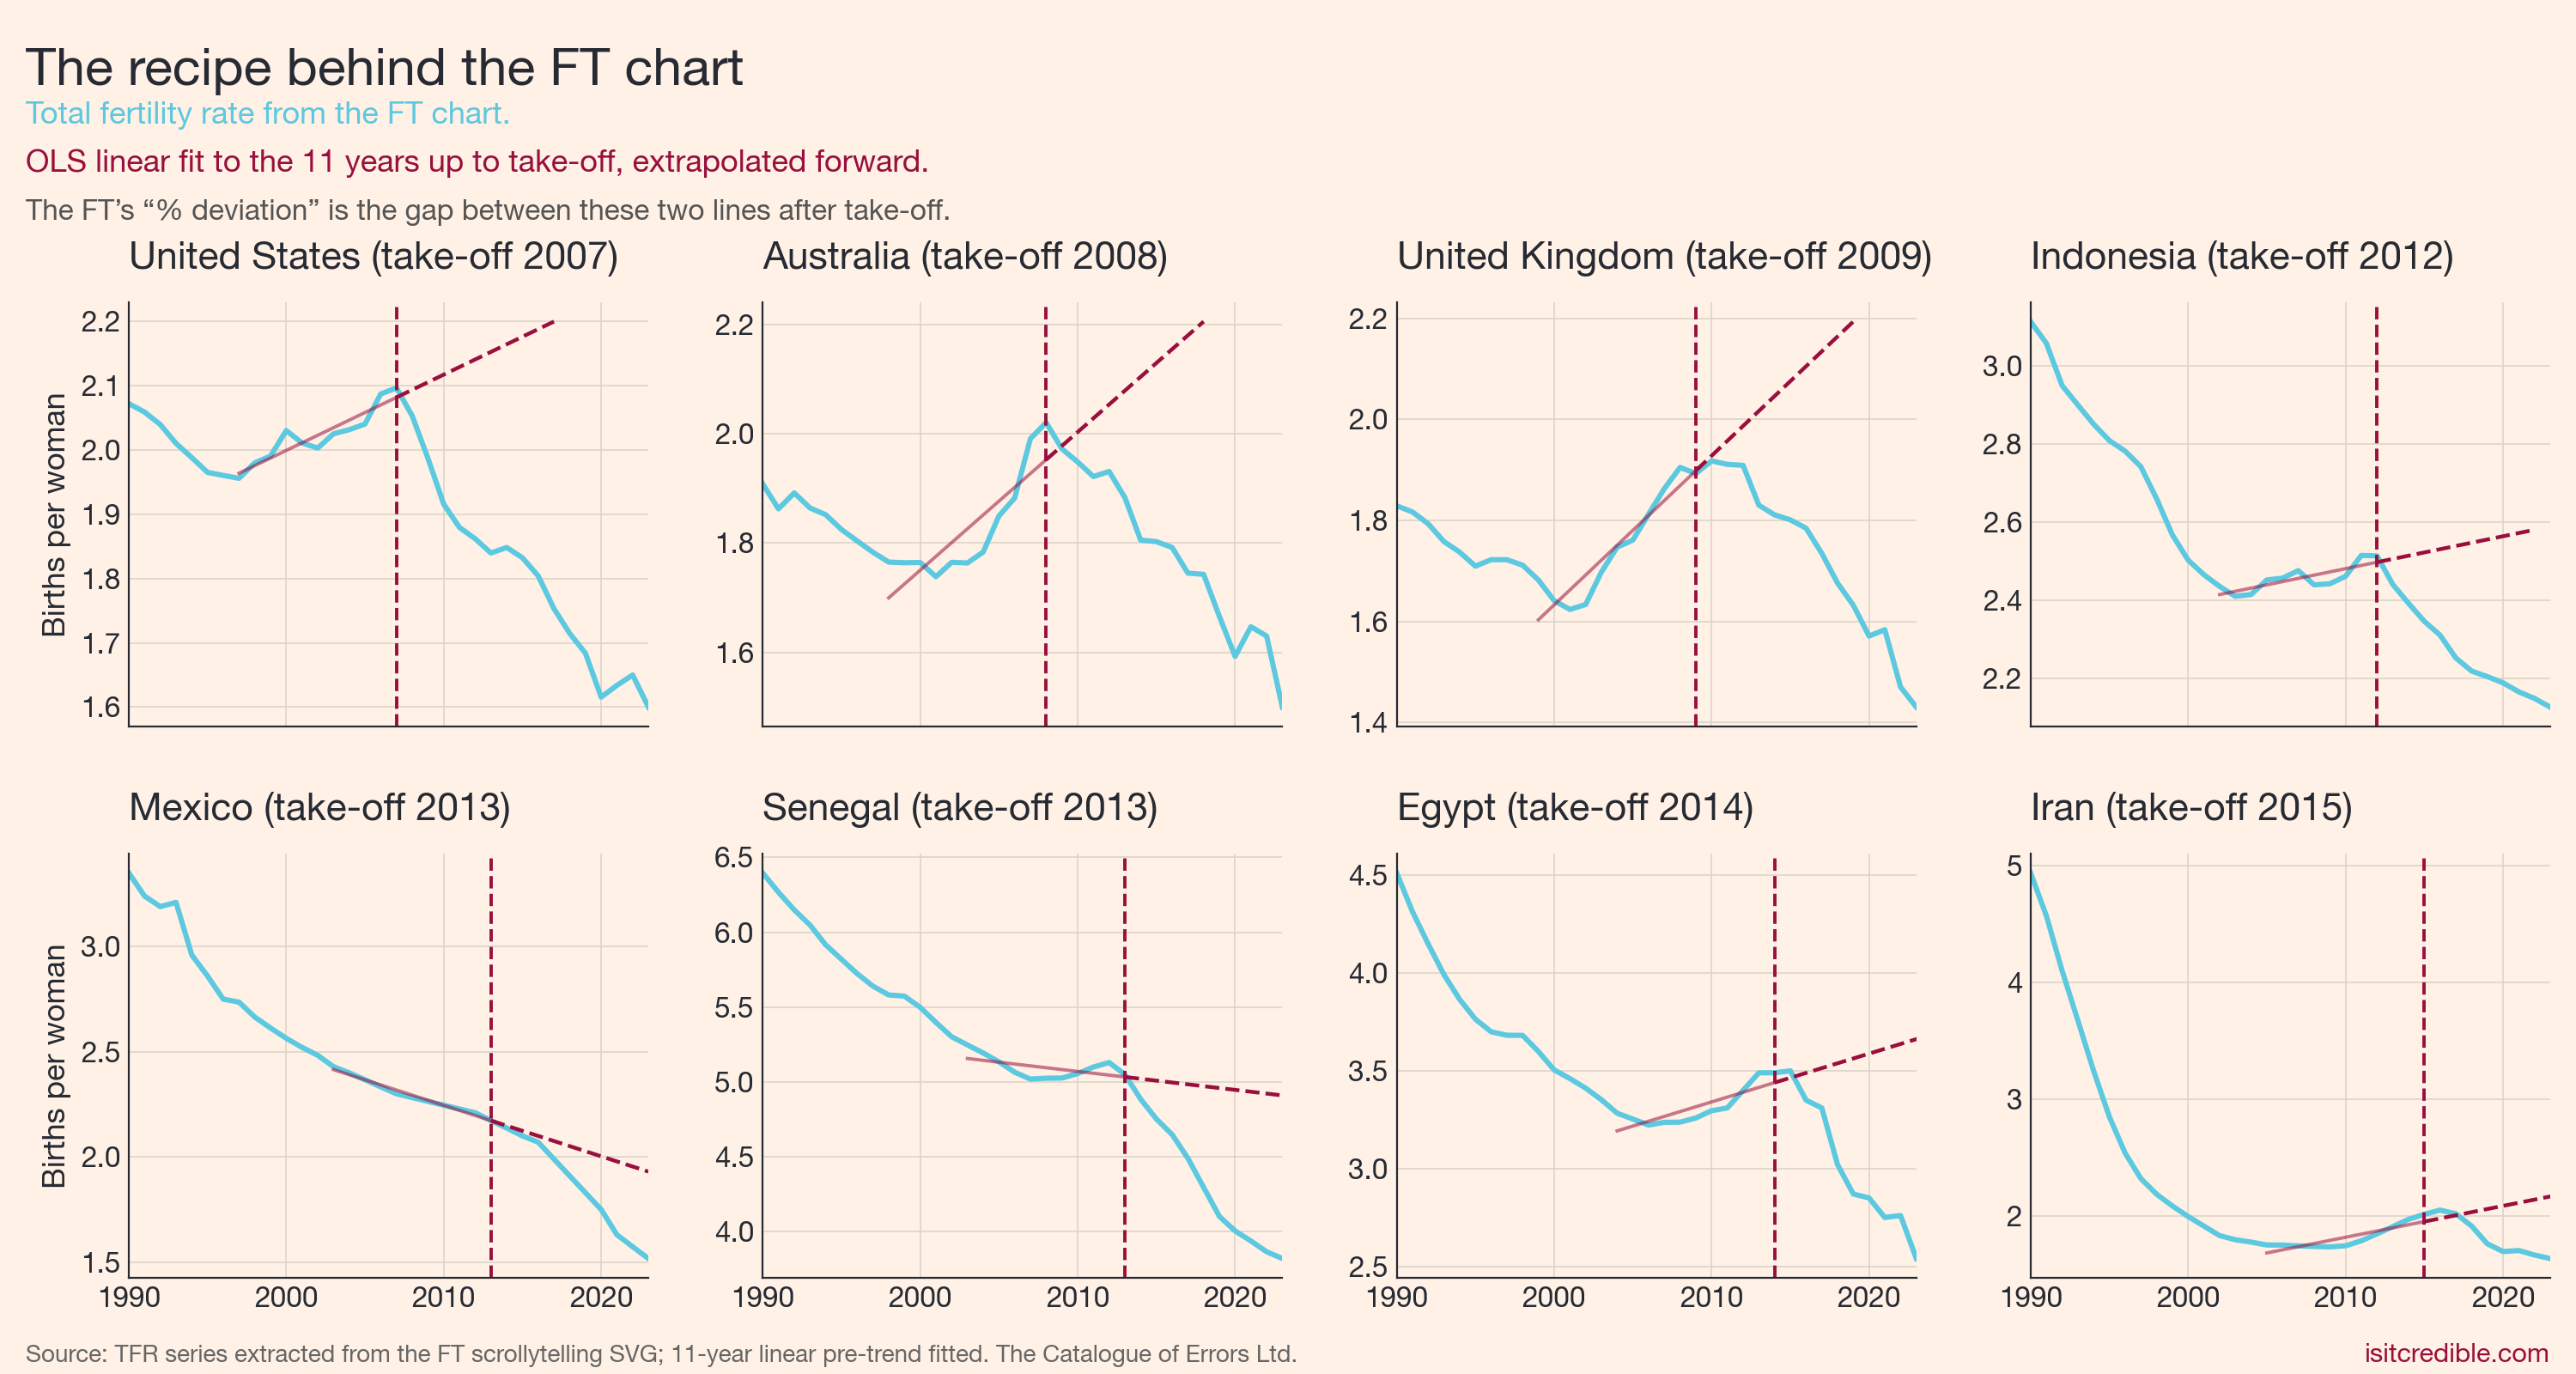
It seems, then, that the FT may have simply cherry-picked years to produce an apparent treatment effect. The chart's published "% deviation" is the gap between each country's actual TFR and the straight line you get by fitting the eleven years up to take-off and extending it forward:
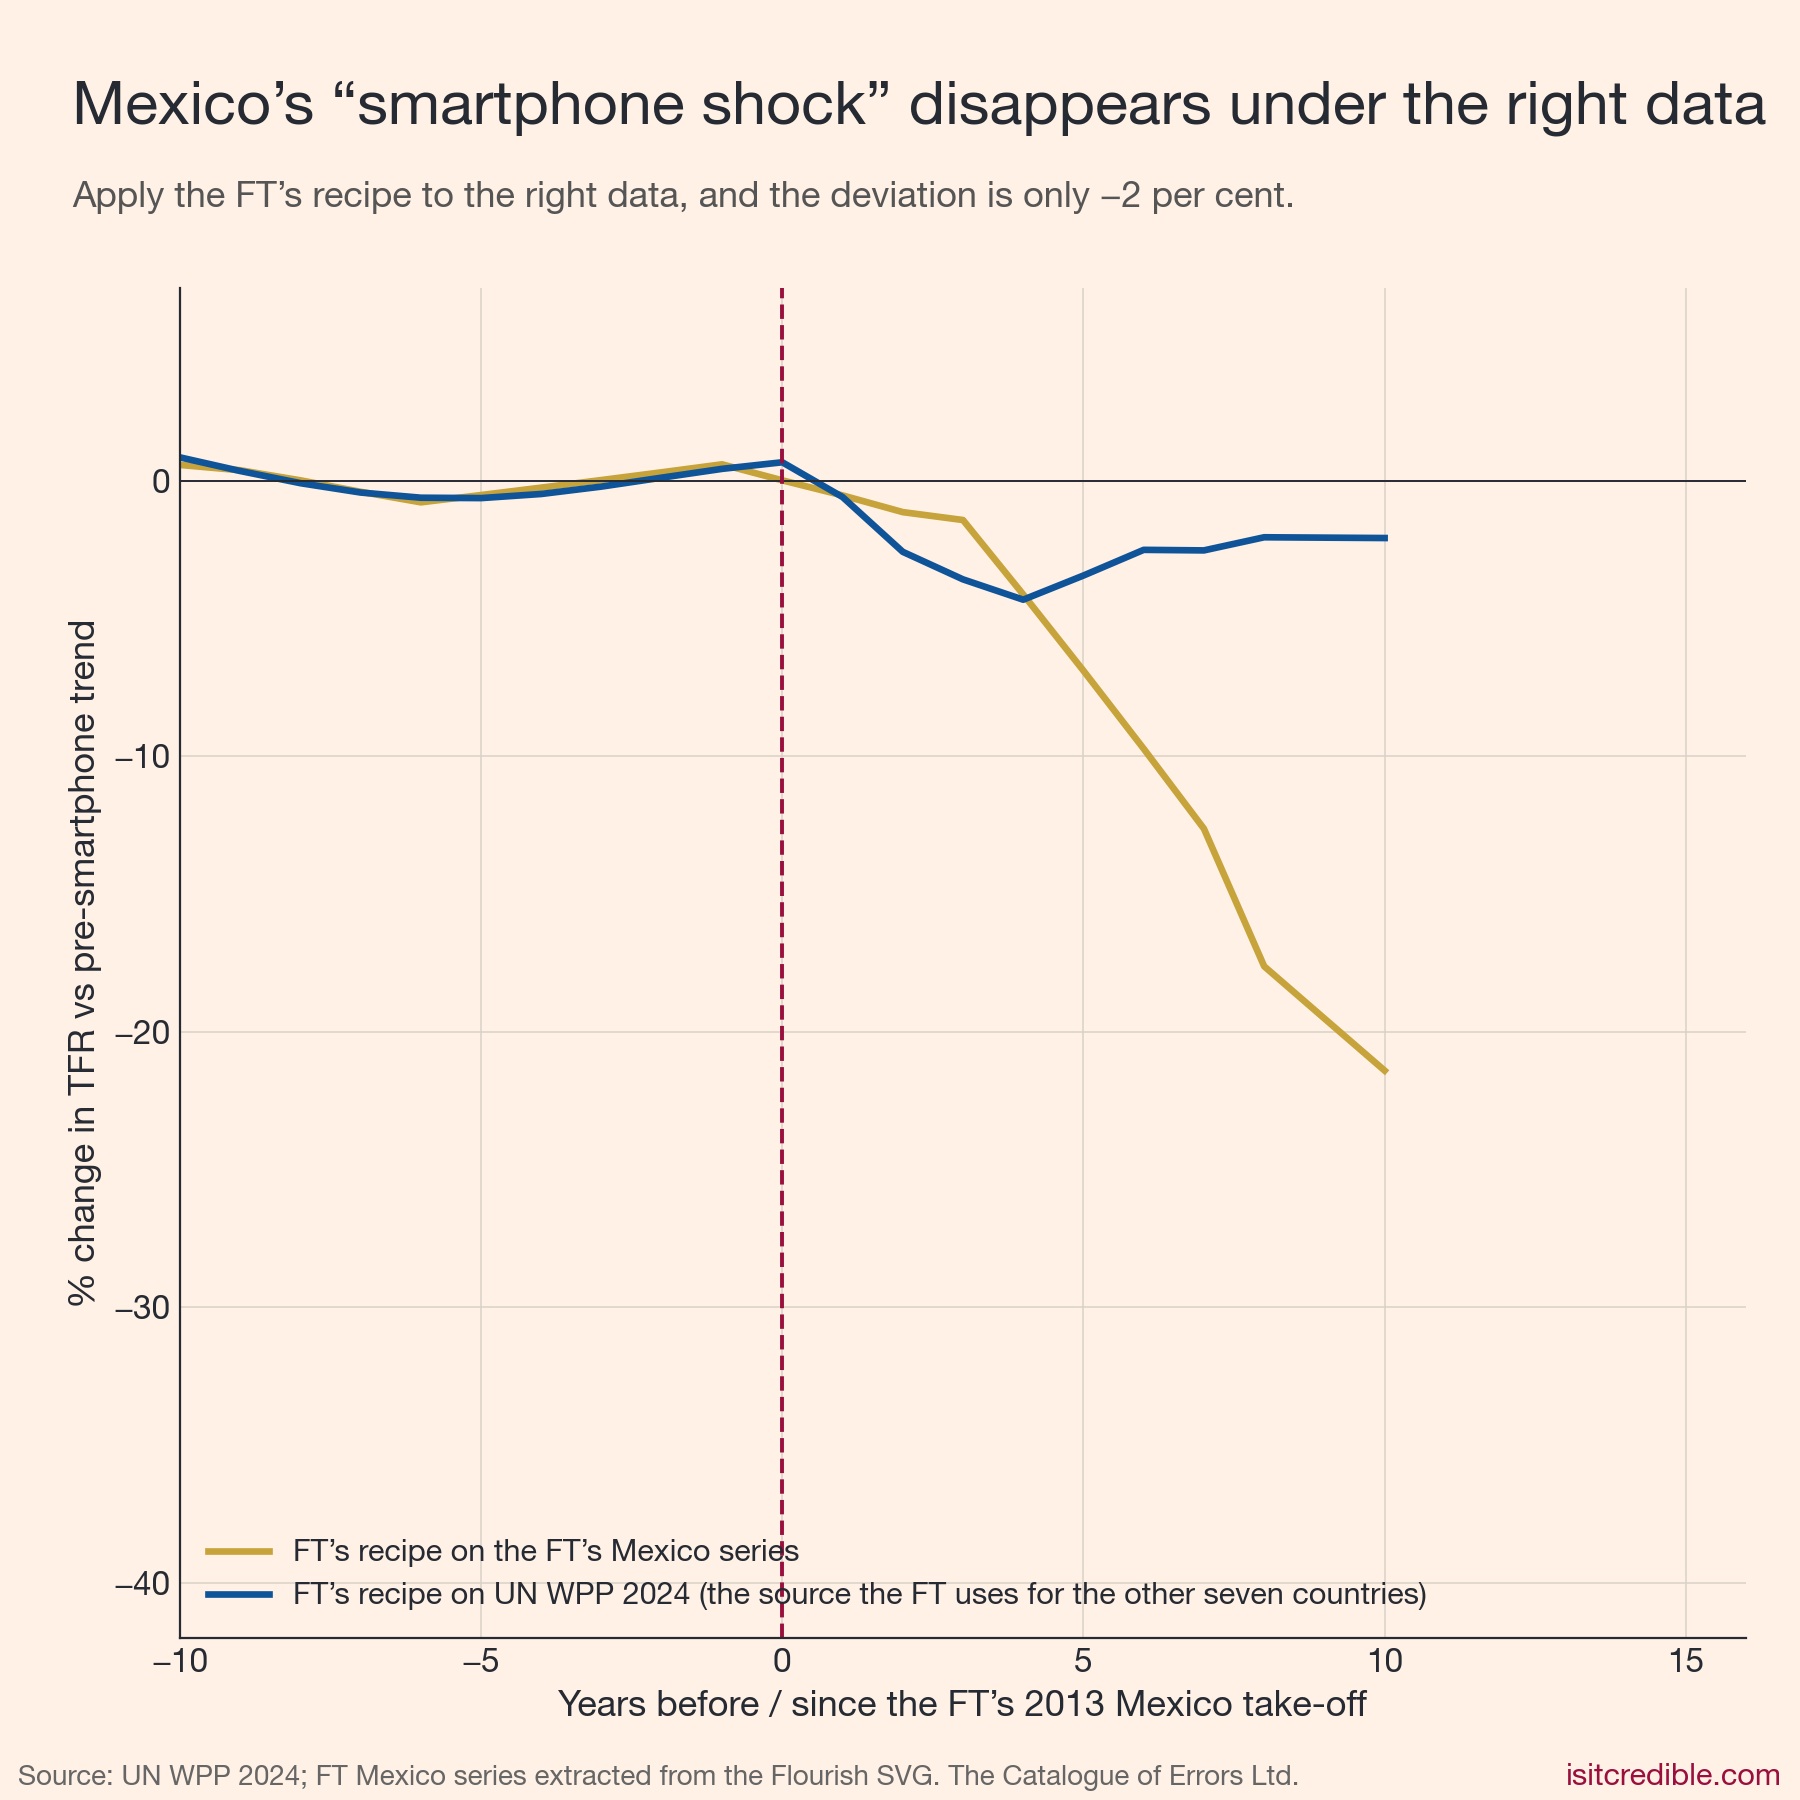
Furthermore, the total fertility rate data for one of the eight countries appears to be of unknown provenance. For seven countries, the data come from the UN World Population Prospects 2024, but for Mexico, they do not match. The FT also cites "national statistical agencies." For Mexico, they seem to have used the older, superseded 2017 edition of the UN World Population Prospects for 2004, 2007 and 2012 as benchmark years before the supposed "smartphone take-off" in 2013. They then interpolated between those benchmarks to get the pre-treatment period. Two of their post-2013 anchor values (1.75 for 2020 and 1.517 for 2023) do not match any published source we have been able to locate, and the resulting series shows a far greater treatment effect compared to the actual series from the UN World Population Prospects 2024, which is identical to the series from Mexico's national statistical agency:
All of our replication scripts and data are available on our GitHub.